
Real time monitoring for IT Infrastructure, Apps, Logs, Websites and devices
BangDB app monitoring tool enables you to monitor almost everything that you use for your business. Using simple UI workflow, it allows you to add cluster, hosts or any kind of services for real-time 24/7 monitoring and analysis.
You can deploy it on-prem or use it on cloud as SaaS or in hybrid mode. BangDB integrates the Stream, Graph Processing with AI to enable analysis of the monitored events along with the actions that could be taken in real time.



Enterprise-Grade & compliance
Built with security and privacy in mind
ISO
9001
Quality Management System (QMS)
ISO
27001
Information Security Management System (ISMS)
CASA
Cloud Application Security Assessment (Google), App Defense Alliance (ADA)
SOC 2
Type II

Audit report covering Security, Confidentiality, Availability, and Privacy Policy
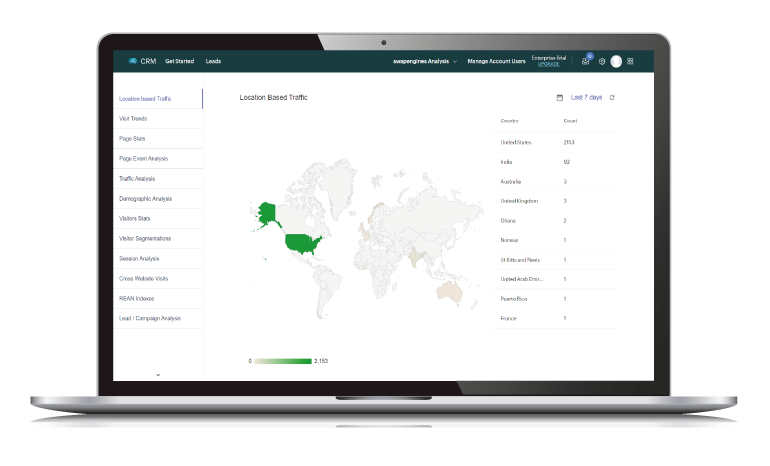
Fully baked up data monitoring and analysis in real-time
The app comes loaded with all necessary elements, plugins and configurations. App abstracts all complexities and does all heavy lifting to get started in simple manner.
- Monitor almost all kinds of IT Infrastructure including devices and servers
- Real-time system and custom log file monitoring and analysis
- Website health and performance with SSL certificates and error monitoring
- Clickstream event analysis for visitor insights in Real-time
- Server, Linux, windows, devices, network, websites, logs, apps and more, all in one place
Simple UI based workflow
The tool doesn't require sys-admins or dev-ops to accomplish the task. It's built for everyone and anyone can accomplish complex tasks using the UI workflow
- Add clusters, hosts and services and manage them using the UI
- Simple cut-n-paste method to complete the integration process
- Starts ingesting, monitoring and analysis data in few seconds
- Built in plugins to select start immediately
- Monitor, analyse using the interactive dashboards and charts


Enterprise grade IT Infrastructure monitoring
Extensive monitoring for servers, logs, networks and other component of the IT infrastructure in a comprehensive manner to ensure performance and continuity of your business.
- Linux or windows servers, using Agent or agentless
- Network, packets, CPUs, Memory, Files, Disks, Sockets etc.
- System log files, or app log files, or app performance
- Host and service reachability, health, uptime and continuity
- Continuously monitor events/data to find anomalies or patters and take actions
Integrated Log analyser
You can send logs from systems and applications to the log analyser for real-time monitoring and analysis purposes. You can also analyse logs in hindsight using the ad-hoc log analysis feature.
- Simplify log management by configuring with AppMon
- Monitor logs, tail, analyse, query in real time
- Setup complex event pattern for auditing or finding anomalies
- Correlate logs or events across different system
- Visualize log data using interactive dashboards and charts


Integrated incident and ticket management system
The app may find issues or incidents which will be reported using the notification mechanism, but you may also route these issues to the centralized and integrated ticket management system.
- Anomalies, issues are automatically sent to ticket management system
- You can manage the life cycle of issues with enterprise grade management system
- Use management is also integrated to assign tickets to users for resolution
- Set quotas, for team members, business hours
- Add custom fields, tags, or workflow as required
- Analysis for tickets, projects and reports for better insights
Website health, performance, security and visitor analysis
You may also set up monitoring for your websites for system performance, health, SSL certificate expiration or for errors. And you may also get the total in-depth insights of the visitors and their behavior.
- Fully baked up clickstream analysis with all the features
- Simple integration with multiple websites
- Real-time stats, Page Event Analysis, Traffic Analysis, Session Analysis
- Visitor trends, Visitor Segmentation, Cross websites visits, User's behaviour
- Security and health of websites, errors and availability
- Performance of website in detail, with insights on page speed, good or bad parts
Testimonials
"IQLECT has worked on initial ontology project for Cisco product and support pages to help automate processes in the CRM team. An integrated ML/IE layer gives our solution a much-needed edge. We foresee lots of potential going forwardand look forward to a much deeper engagement with them."
 Amit DCISCO
"Based on my experience as a CTO, BangDB is a fantastic database solution which offers high performance, scalability, and reliability. Powerful APIs and broad set of features made it easy to integrate into our solutions. I appreciate the level of support and documentation provided by the BangDB team. The collaboration was truly exceptional and we managed to tune the database exactly the way we needed. Overall, I have had a great experience using BangDB and would highly recommend it to others for their data storage & real-time processing need"
 Tomasz HanusiakSenior Software Engineer, IBM
"BangDB is a product that has good potential to cater to the real-time data analysis needs of an organization. The NOSql database provides you with a much more efficient alternative to the traditional relational database system like Microsoft SQL. The data is readily interconnected and ripe for the taking by any big data ingestion systems. The support from the BangDB team has been very responsive and reliable. It has made the adoption of their product much much easier. Overall, I'm looking forward to utilize BangDB to the best of its capability to help in achieving our organization's goals."
 Rahul AhujaTVAM
"We partnered with IQLECT to develop an end-to-end marketing automation and lead generation app which increased the conversion rate by 2x and generated 15% more incremental leads. IQLECT is the next best thing for the next best action. IQLECT purpose-built NoSQL, BangDB brings a convergence of AI and streaming to enable hyper real-time scenarios which are needed to solve such advanced problems. We did not find any other vendor who could match the business outcomes generated by IQLECT."
 Haider KhanAccenture
Enterprise-grade IT Infra monitoring
System and app Log analyser
Website performance monitoring
Clusters, hosts, services monitoring
Agent or agentless monitoring
Real-time stats and insights
Integrated ticket management system
Patterns, anomalies identifications

How To Install
This guide covers installing the Leads Management App, ensuring a seamless integration into your workflow. It provides step-by-step instructions for installing the app, granting access to powerful tools that enhance leads management efficiency.
Learn more
How To Use ( Docs )
This documentation serves as a comprehensive guide to effectively utilize and manage the Leads Management App. It covers every aspect from initial setup to advanced features, ensuring users can maximize their productivity and efficiency.
Learn more| Sl No | Features | BangDB | DataDog | NewRelic | Dynatrace | LogicMonitor | Nagios | AppDynamics | Splunk |
|---|---|---|---|---|---|---|---|---|---|
| 1 | Full Stack Observability | Yes | Yes | Yes | Yes | Yes | No | Yes | Yes |
| 2 | Application Performance Monitoring | Yes | Yes | Yes | Yes | No | No | Yes | Yes |
| 3 | Log Management and Analysis | Yes | Yes | Yes | Yes | Yes | No | Yes | Yes |
| 4 | Real-Time Infrastructure Monitoring | Yes | Yes | Yes | Yes | Yes | Yes | Yes | Yes |
| 5 | Servers Monitoring | Yes | Yes | Yes | Yes | Yes | Yes | Yes | Yes |
| 6 | Logs Monitoring | Yes | Yes | Yes | Yes | Yes | Yes | Yes | Yes |
| 7 | Network Monitoring | Yes | Yes | Yes | Yes | Yes | Yes | Yes | Yes |
| 8 | Processes Monitoring | Yes | Yes | Yes | Yes | Yes | Yes | Yes | Yes |
| 9 | Clusters Monitoring | Yes | Yes | Yes | Yes | Yes | No | Yes | Yes |
| 10 | Website Monitoring | Yes | Yes | Yes | Yes | Yes | No | Yes | Yes |
| 11 | Clickstream Analytics | Yes | Yes | Yes | Yes | No | No | No | Yes |
| 12 | Health of the Host | Yes | Yes | Yes | Yes | Yes | Yes | Yes | Yes |
| 13 | System Health | Yes | Yes | Yes | Yes | Yes | Yes | Yes | Yes |
| 14 | Alerts and Notifications | Yes | Yes | Yes | Yes | Yes | Yes | Yes | Yes |
| 15 | Root Cause Analysis | Yes | Yes | Yes | Yes | Yes | No | Yes | Yes |
| 16 | Correlation of Data | Yes | Yes | Yes | Yes | Yes | No | Yes | Yes |
| 17 | Pattern and Anomalies Detection | Yes | Yes | Yes | Yes | Yes | No | Yes | Yes |
| 18 | Running Stats and Complex Event Processing | Yes | Yes | Yes | Yes | No | No | Yes | Yes |
| 19 | SSL Certificates Monitoring | Yes | Yes | Yes | Yes | Yes | No | Yes | Yes |
| 20 | AI-Powered Analysis (Train, Deploy) | Yes | Yes | Yes | Yes | No | No | Yes | Yes |
| 21 | Visualization, Dashboards, Charts | Yes | Yes | Yes | Yes | Yes | Yes | Yes | Yes |
| 22 | Email Notification Alerts | Yes | Yes | Yes | Yes | Yes | Yes | Yes | Yes |
| 23 | Convert Alerts into Tickets | Yes | Yes | Yes | Yes | No | No | Yes | Yes |
| 24 | Agentless Monitoring | Yes | Yes | Yes | Yes | Yes | Yes | Yes | Yes |
| 25 | Ticket Statistics | Yes | Yes | Yes | Yes | No | No | Yes | Yes |
| 26 | SNMP Monitoring | Yes | Yes | Yes | Yes | Yes | Yes | Yes | Yes |
| 27 | Audit Logs | Yes | Yes | Yes | Yes | Yes | No | Yes | Yes |
| 28 | Cluster Summary | Yes | Yes | Yes | Yes | Yes | No | Yes | Yes |
| 29 | Cost/Price | $19/service | 1.Logs: $0.10/GB/month 2.Linux Monitorning: $23/host/service 3.generic log monitoring: $0.10/GB/month 4.Website Monitoring: $12 /1,000 test runs/month 5.click stream monitor: $1.50/10,000 sessions/month | $0.35/GB | 1. Full-Stack Monitoring: $0.08 /hour for an 8 GiB host. 2. Infrastructure Monitoring: $0.04 /hour 3. Real User Monitoring: $0.00225/session. 4. Website performance : $0.001/synthetic request. | $22/service/month | $1,995 for a 50-node license. | $50/CPU core/month. | $1,800/year |