CLI, Interactive command line interface for BangDB
BangDB CLI
A Lightweight, Secure, and Efficient Tool for Comprehensive Database Operations

A Lightweight, Secure, and Efficient Tool for Comprehensive Database Operations
BangDB Command Line Interface (CLI) allows user to interact with the BangDB in easy and efficient manner. User may perform almost all tasks using the cli that are possible using Ampere ( FE Platform) or REST API. The CLI is a light weight service which may simplify some of the tasks while configuration, monitoring, debugging or doing some real operational work. It takes less than 2 MB in size which is written in C and uses secure SSL to communicate over TCP.
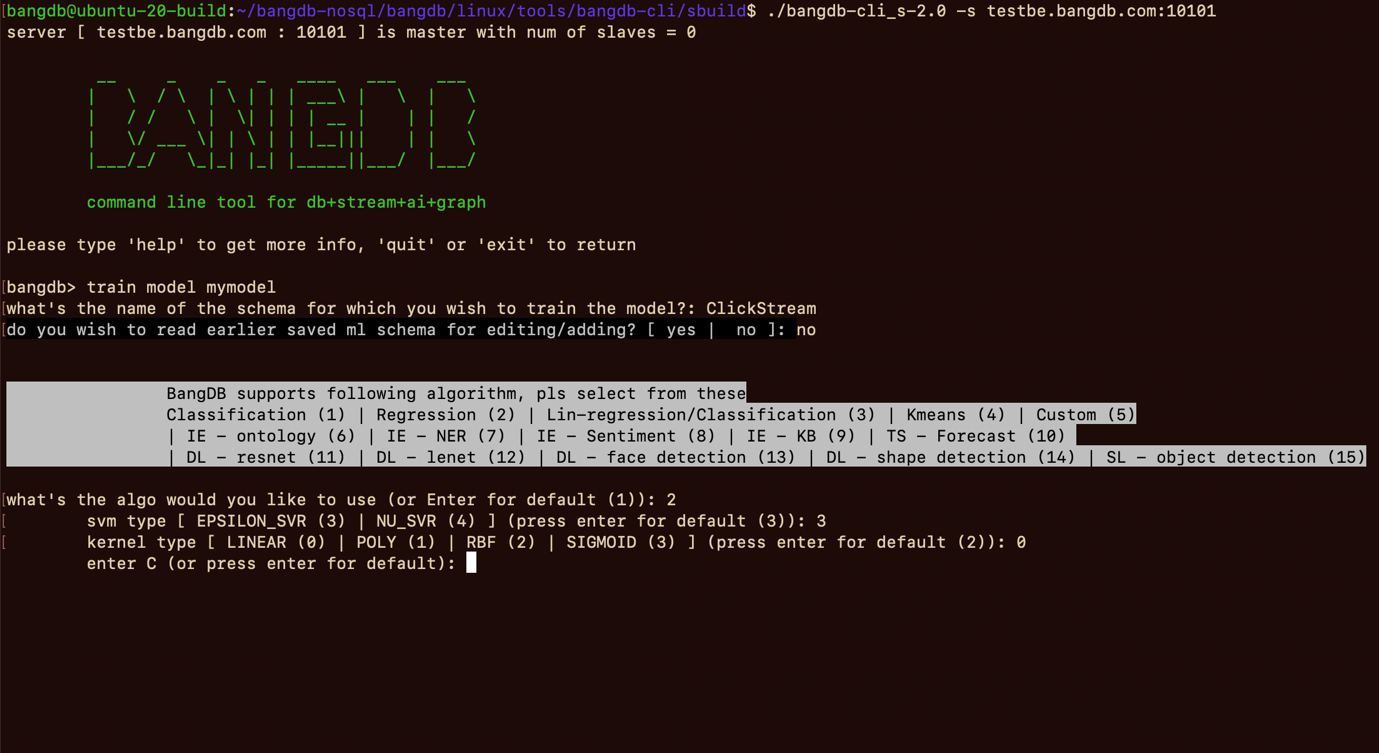
It simply gets installed on the machine and then user may access this from anywhere using terminal. CLI aims to simplify the interaction with the db hence in several places wherever needed, a cli initiates a workflow with simple question and answer session to effectively conclude the process ending with some operation.
Comprehensive Query Support with BangDB CLI
SQL-like Language for Database, Streaming, ML, and Graph Queries

SQL-like Language for Database, Streaming, ML, and Graph Queries
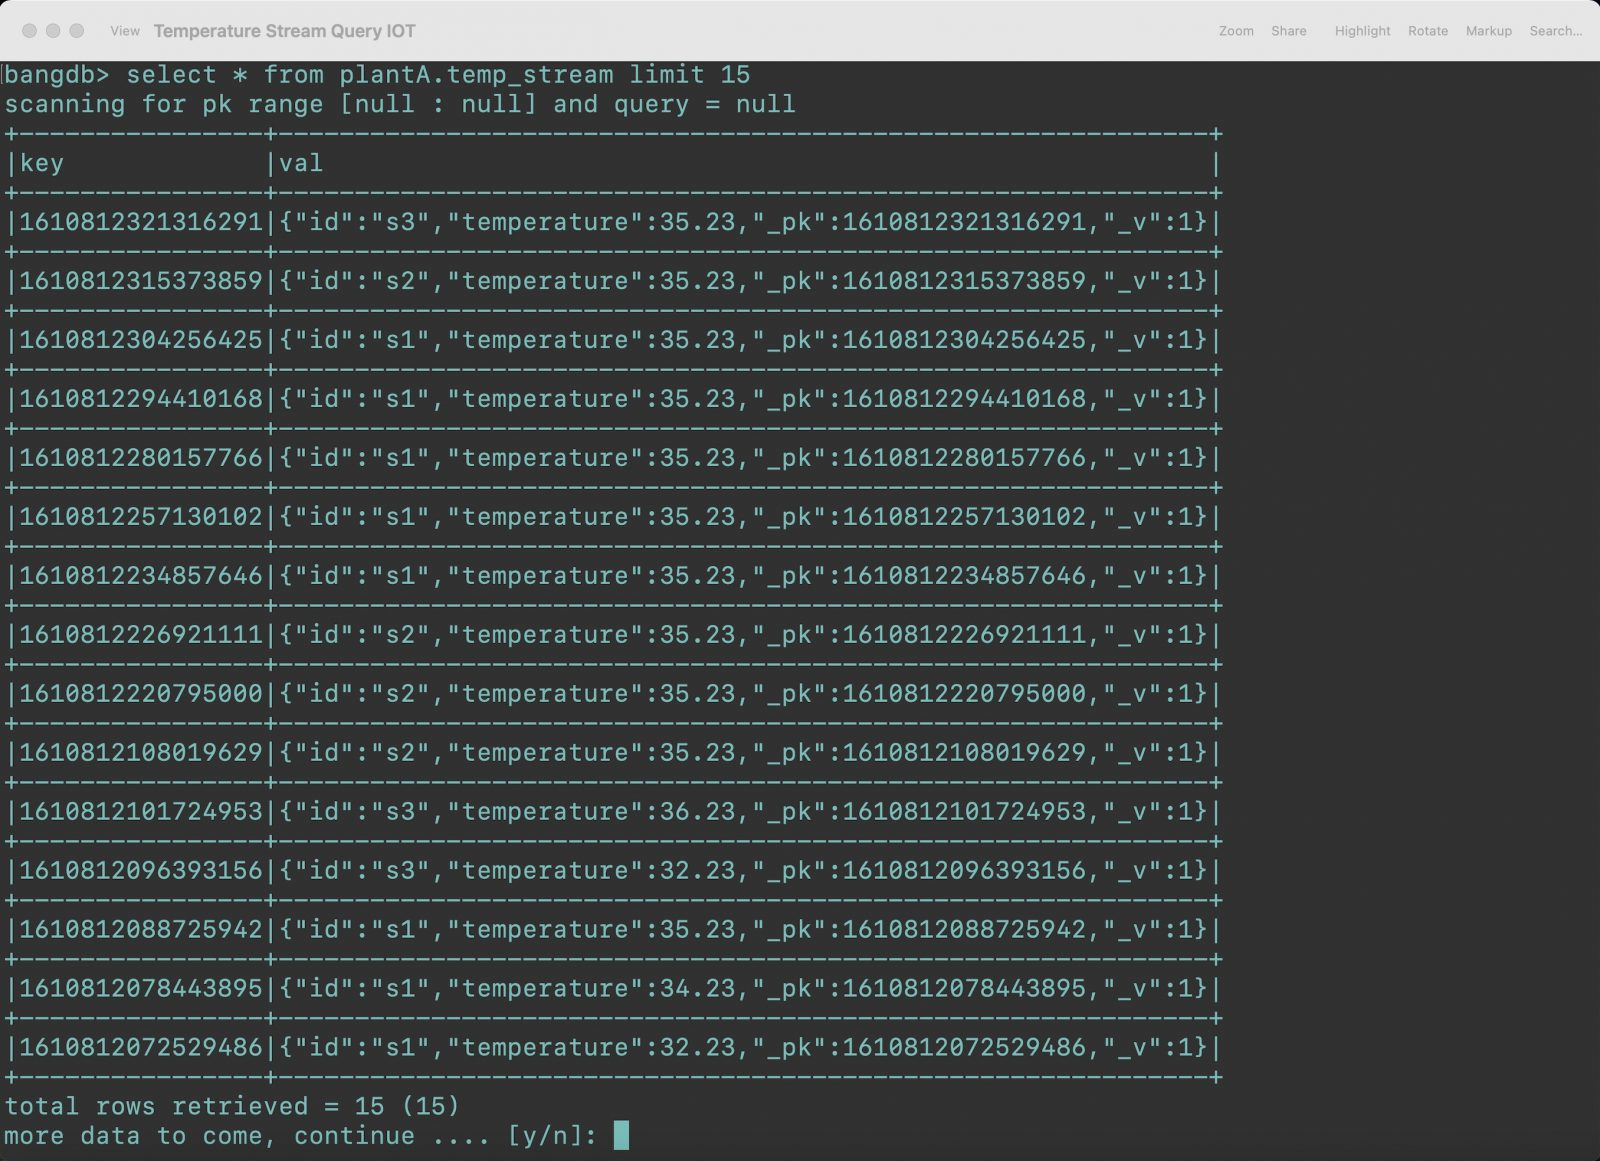
For most of the db queries, SQL like language is used. SQL like language is supported even for streaming and ML related activities, like training, prediction, deployment of models etc. For accessing BRS (buckets and object/file store), again it uses SQL like query.
For Graph query, BangDB supports Cypher and same is also supported through CLI. The data, files or objects or anything inside DB can be viewed and downloaded using CLI. Further CLI can be used for admin purposes as well related to server configuration, replication master and slave switching, agent configuration and settings.
Powerful Data Analysis
Simple Commands for ETL, ML, and Visualization

Simple Commands for ETL, ML, and Visualization
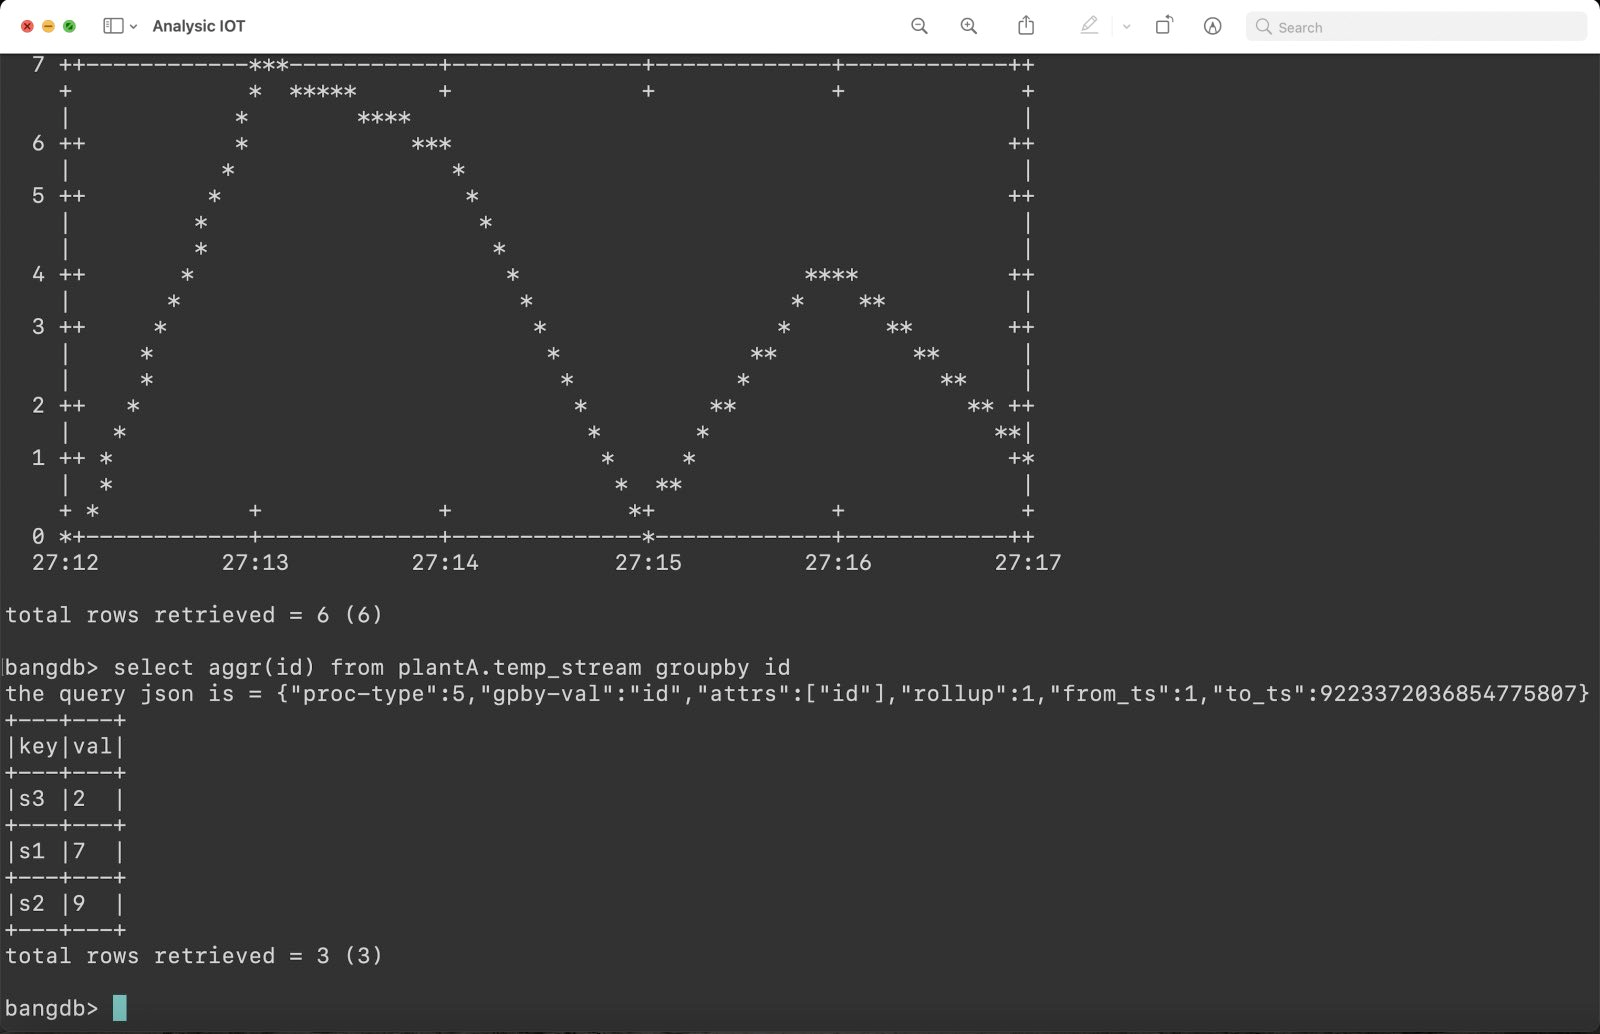
The CLI can also be used for data analysis. It can summarize the data, it allows data ETL and cleanup, training ML models, testing the model and then deploying it, using simple commands. You can also have simple chart drawn on the terminal for better visualization and analysis.